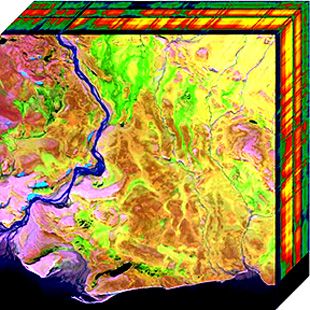
Cover image: A 2D projection of a 3D hyperspectral data cube. Image credit NASA.
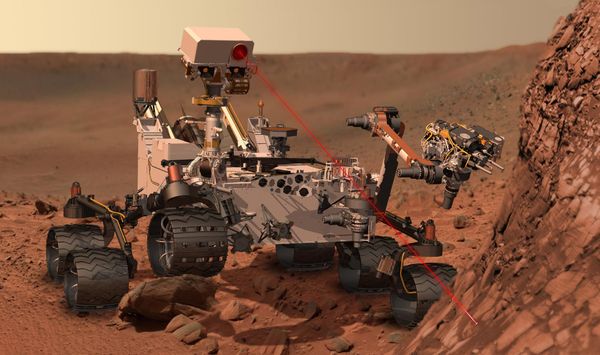
Hyperspectral imaging (HSI), also known as imaging spectroscopy, is a technology that allows remote sensing platforms like satellites or airplanes to use light information beyond what the human eye can perceive to measure and identify the constituents of a target area. For example, hyperspectral imagers have been used to identify which minerals are in rock formations, assess the health of crops, and may even help doctors discriminate between healthy and diseased tissue.
In this article I'll walk you through the basics of hyperspectral imaging, and show off some amazing pictures along the way.
But first, what is light?
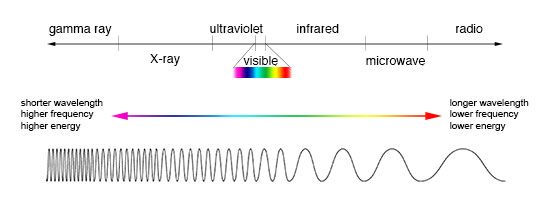
For a quick refresher, light is part of the electromagnetic spectrum. Electromagnetic (EM) waves with lots of energy like Gamma rays and X-rays fall at one end of the spectrum, while low energy waves like radio fall at the other. Our eyes are sensitive to a small segment of the spectrum aptly called the "visible" region.
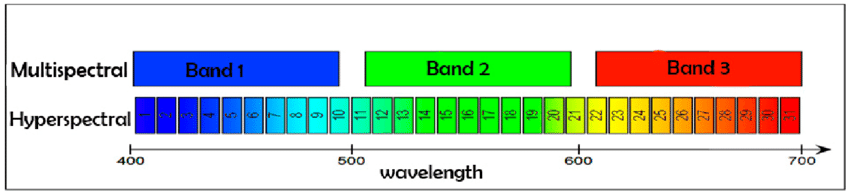
The "-spectral" part of "hyperspectral" refers to light measured with respect to wavelength, rather than all the photons that might end up going into the instrument. "Hyper-" simply means many wavelengths are considered. For perspective, if an instrument was sensitive to 6 different wavelengths it would be considered "multispectral", while a hyperspectral instrument might be able to measure the photons from hundreds of wavelengths.
Hz, microns, nanometers, eV... which units are correct?
All of them! Which units are used depends partly on how the EM waves are measured and used, but also because it makes sense to use convenient units. To reduce confusion, I'll relate everything back to wavelength.
Electromagnetic waves are oscillations travelling at the speed of light. Generally oscillations are measured in Hertz (Hz, or cycles per second). Since the waves travel at a known speed, c = 3 x 10⁸ m/s, one complete cycle or wave moves through space at the speed of light, travelling some distance in meters, called its wavelength. "Micron" is a fancy name for micrometer (1 x 10⁻⁶ meters). Since all electromagnetic waves carry energy, the spectrum may also be quantified in terms of electronvolts (eV) which is basically shorthand for 1.60218 x 10⁻¹⁹ Joules, the charge of one electron.
Longer wavelengths like radio use Hertz partly due to history. Heinrich Hertz discovered radio waves in the 1880s, naturally relating his observations of predictable oscillating electric waves to frequency. Very short wavelengths like X-rays are hard to measure and very fast. EM radiation in this area of the spectrum are measured by the amount of energy in each photon, so it makes sense to use precisely that unit! Light is measured in nanometers (1 x 10⁻⁹ m) or microns (1 x 10⁻⁶ m) because these wavelengths are on convenient scales for people to work with.
Did someone say quantum physics?
No, but one last term you should be aware of is a "band," which is how we can refer to any discrete region of the spectrum. This is important because quantum physics makes it impossible to measure photons one wavelength at a time. Without getting too deep in the weeds, just remember that every time we measure light, we are collecting photons from a distribution of wavelengths in a "band." Hyperspectral imagers are able to measure very narrow bands one at a time.
Splitting the spectrum
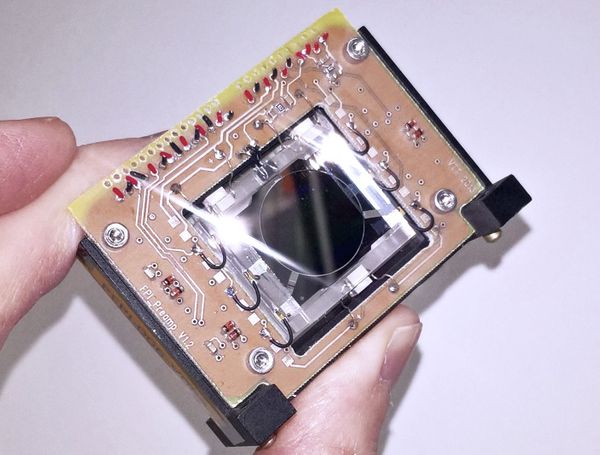
So how do we zero in on a small portion of the spectrum? Your first thought might be to filter out everything but a very narrow band, but this doesn't scale well when you need hundreds of unique bands (although new technology might change my mind). Instead, a dispersive element is used, which separates the wavelengths of the incident light like Newton with his prism experiment. A more common dispersive element is diffraction grating, which is a reflective substrate with a cross section that looks like a sawtooth. As the name implies, these elements make use of diffraction to separate the incident light. I won't get into the physics of diffraction in this article here, but I'll leave you with some helpful resources and encourage you all to explore the wonderful world of optics on your own.
Getting an image
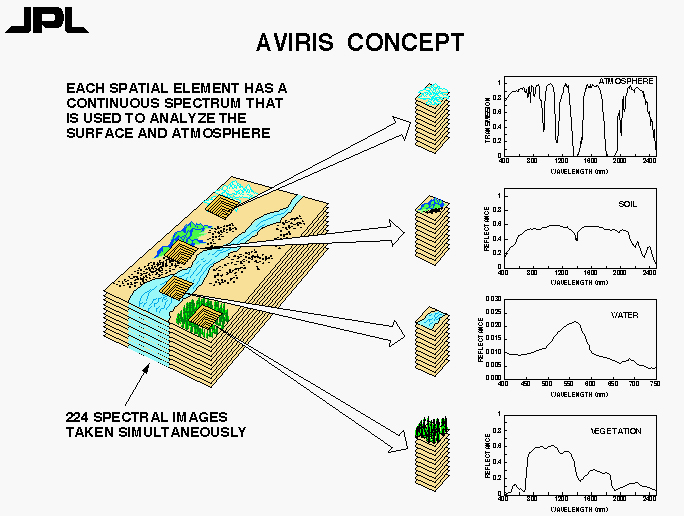
We get to HSI by bringing arrays of imaging detectors into the mix. The main advantage to a hyperspectral imager is that the spectral, or wavelength dependent, component of a scene can be coupled to spatial information. In broadband imagers that we're used to, there are the obvious spatial coordinates x and y. For our hyperspectral imager we want to obtain spectral data for each (x,y) coordinate of the image. If we treat wavelength, λ, as a third dimension to our image we get a 3D data cube with the axes x, y, and λ.
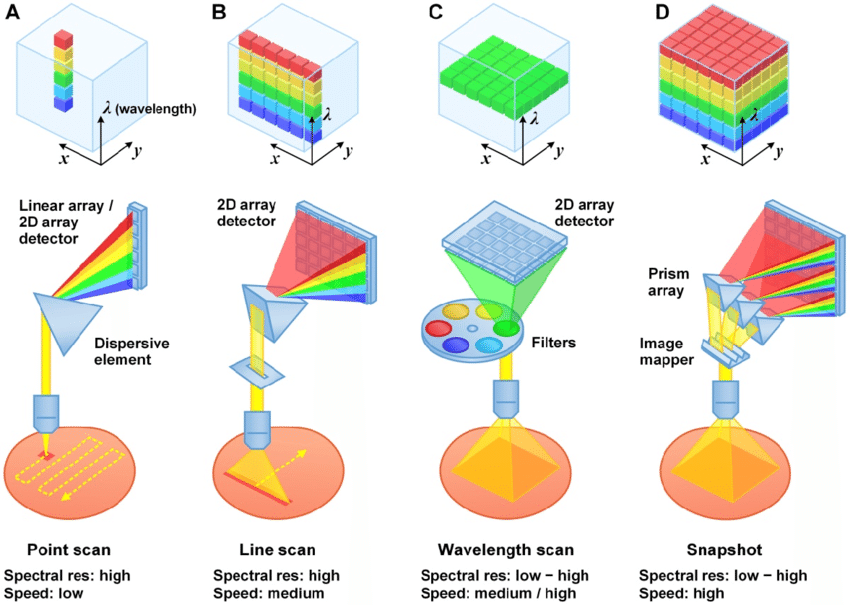
There are four ways we can collect data for each coordinate in the 3D cube:
A. Point scanning (whiskbroom scanning). For a single (x,y) coordinate, all λ are recorded. The imager sweeps across both x and y axes.
B. Line scanning (pushbroom). All λ are recorded for all y coordinates, an entire column of pixels is captured. The imager sweeps across the x axis. This method works great for satellites and airborne platforms. (Leaving out the λ coordinate, this is how your scanner works at home!)
C. Area scanning. All (x,y) coordinates are recorded like a "regular" camera, and the imager sweeps along the λ axis to form the data cube.
D. Single shot. All three coordinates (x,y,λ) are recorded at once.
The big data problem
There is one issue with HSI systems beyond the fancy optics---data. Consider the sensor in your everyday smartphone camera. A standard 1920 x 1080 image has a total of 2,073,600 spatial coordinates in RGB (red-green-blue) image. To record it, the sensor recorded 3 values per pixel: one value for the response in the red band, one value for green band, and one for the blue band. That brings us to 6,220,800 values to keep track of. Now consider a hyperspectral imager, where each image coordinate may have hundreds of values in the spectral domain. Holy big data!
Modern computers are much cheaper and more powerful than ever, opening doors to faster processing of HSI data and even hyperspectral video. Coupled with new computing techniques like deep learning and computer vision, I think hyperspectral imaging could lead to major breakthroughs in science and technology in the years ahead.
Check out my other article, Space Applications of Hyperspectral Imaging, which dives into the space remote sensing applications, space probes, and discoveries made via hyperspectral imaging.
Further Reading
- A free, detailed resource for understanding the finer details of hyperspectral imaging: Adão, Telmo, et al. "Hyperspectral imaging: A review on UAV-based sensors, data processing and applications for agriculture and forestry." Remote Sensing 9.11 (2017): 1110.
- A well written article discussing the various applications of HSI with superb visuals: Coffey, Valerie C. "Hyperspectral Imaging for Safety and Security." Optics & Photonics News (2015).
- A look at more real-world applicatitons for hyperspectral imaging: https://www.photonics.com/a25139/Hyperspectral_Imaging_Spectroscopy_A_Look_at
- HICO and RAIDS, a hyperspectral imager that characterizes ocean and coastlines, is mounted to the ISS: https://www.nasa.gov/mission_pages/station/research/experiments/689.html
- AVIRIS, a NASA hyperspectral instrument with a long and prosperous history: https://aviris.jpl.nasa.gov/aviris/imaging_spectroscopy.html